While Interning at The City of Burnsville…

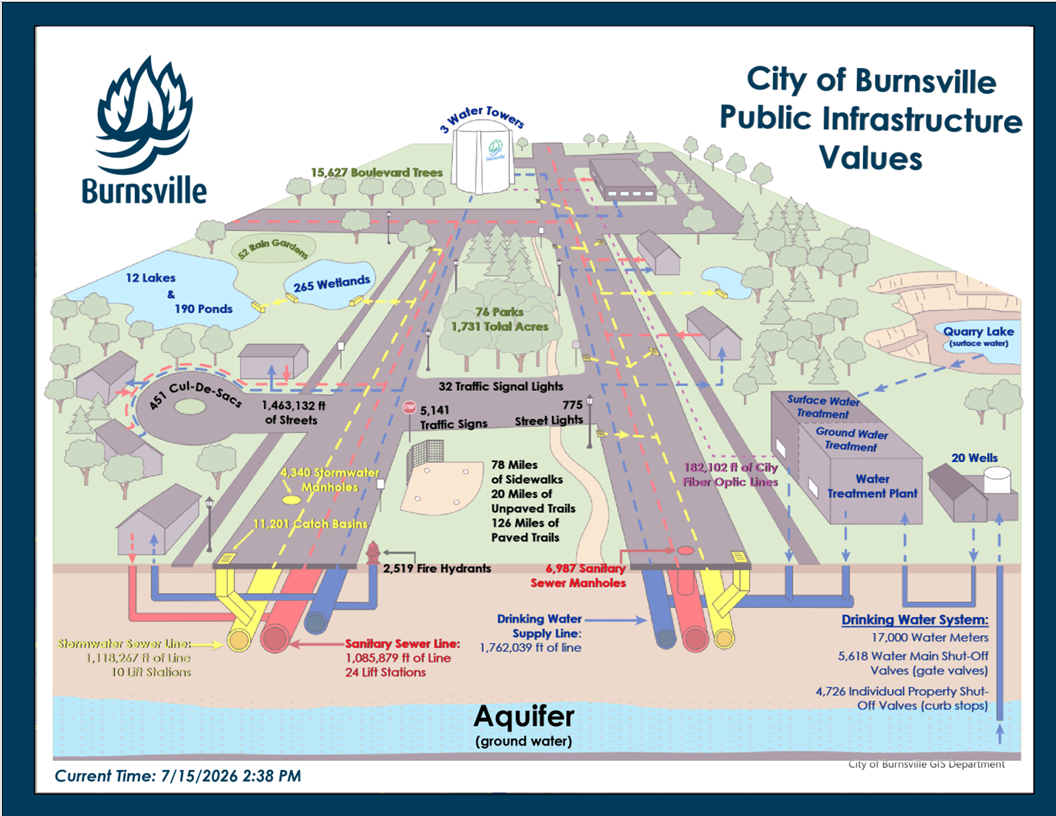
I took an existing static infographic used by the Engineering Department and created a dynamic infographic that kept up to date with all changes made to the source data. The Engineering Department uses the infographic at public events to visualize the total assests maintained by the City of Burnsville.Project Links:
This project is used internally only and has no public facing presence online.
Process:
The base image was provided by the Communications Department. Dynamic Text boxes were added in across the page and color coded to match elements on the base image. Each dynamic text is associated with a data connection to that every time Engineering opens the project, the latest and most accurate values are what appear on the layout.
Engineering uses this layout every year at the Burnsville Public Works Open House event and would have to recreate the layout each year and calculate the values each year. This project was a straightforward way to make their workload easier each year, all they have to do is reopen the project, and print a new physical copy.
Skills Learned During Project:
How to properly create a query table from multiple sources to create one output to attach to dynamic text.